How exposed is my portfolio to the U.S. stock markets?
- Noel Watson

- Nov 12, 2024
- 4 min read
Updated: Apr 7
Introduction
Things are currently busy at Pyrford Financial Planning Towers as we are in the middle of our annual review process, where we discuss the year ahead with our clients and update their retirement plans. During one of these meetings, a couple asked:
"How exposed are we to the U.S. markets?"
My initial answer was something along the lines of "it's relative/it depends." We wanted to give a more comprehensive answer, and as with previous client questions, where we think some of our other clients (and non-clients!) might be interested in our research, we committed to writing a blog to answer this question in more detail.
Given that our most popular blog (measured by clicks over the last month) discusses the S&P 500's lost decade (we never thought that our SJP fees and performance analysis would get knocked off the top slot!), we believe there is a good chance that this blog will also prove popular!

The client's question could be interpreted and answered in many different ways, and we attempt to provide a detailed analysis below. We have selected a range of portfolio asset allocations, examining how each option impacts the exposure of the portfolio to:
The equity component of the largest U.S. companies.
U.S. equities in general.
It's worth mentioning that this blog solely focuses on the relative exposures for the portfolios in question. If you want to understand the potential implications on retirement income sustainability of taking a concentrated position (or not), we recommend reading the many other blogs we have written on the subject.
Portfolio 1: 100% S&P 500
One of the most popular indices in recent years is the S&P 500, which contains 500 leading U.S. large-cap equities. Over the last decade, it has performed very well relative to other indices/markets, hence its popularity with many investors, who sometimes appear more concerned with investing in "what is working now" rather than taking a longer-term view in an effort to minimise the chance of blowing up their retirement plans.
To analyse the exposures listed above, we will look at the following measures.
Apple
At the time of writing, Apple is the largest constituent of the S&P 500 (7.27%), and we consider it a reasonable marker of U.S. large company equity exposure in our example portfolios.
Percentage of U.S. equities
As might be expected, (almost) 100% of the equities in the S&P 500 are U.S. based (the actual number is 99.37%).
Equity style box
We recently examined equity style boxes in our analysis of factor investing. The S&P 500 index is (as expected) heavily tilted (82%) to large-cap companies.

Portfolio 2: Total U.S. stock market
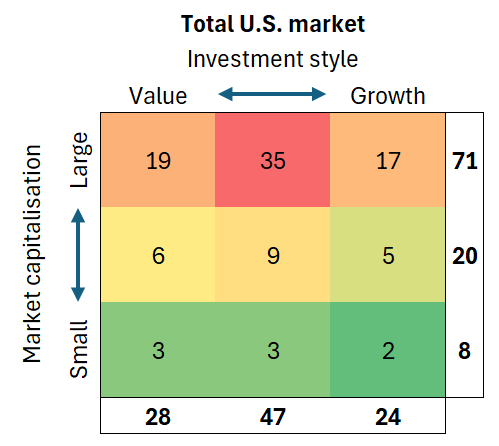
While many investors focus on the S&P 500 when considering U.S. equity markets, this is a subset of the overall U.S. market, with the Total Market Index providing a more comprehensive coverage of U.S. stocks. The Total Market Index reduces individual share concentration slightly, with Apple's exposure reduced by almost 1% to 6.31%, while the style box is somewhat diversified away from large-cap stocks (82% vs. 71%). U.S. equity exposure remains close to 100%.

Portfolio 3: 100% Global equities (No Brainer)
What if we adopt a more global approach, as detailed in our no-brainer portfolio analysis? If we examine the FTSE Global All Cap Index, which covers around 10,000 stocks across developed and emerging markets, our Apple exposure is dramatically cut to 3.76%, while our overall exposure to U.S. equities is now at 61.85%.

Portfolio 4: 70% Global equities, 30% global bonds (No Brainer)
If we now look at a more real-world example (we've previously discussed why a 100% equity portfolio probably isn't suitable for most retirees), taking a portfolio of 70% equities and 30% bonds (but still using the No Brainer approach), the Apple concentration is now reduced to 2.63%, while the equity style box and U.S equity exposure (as a percentage of the overall portfolio) is unchanged.
Portfolio 5: As Portfolio 4 but with tilts (our client's portfolio)
Finally, we look at our client's portfolio, which adopts factor tilts to small-cap and value premiums and a slight tilt to emerging markets (Tim Hale adopts a similar approach, which he covers in his excellent book). Apple exposure is now down to 1.96%, over 70% less than in the S&P 500, while the U.S. market exposure is 56.55%, and the equity style box shows increased diversification across the various styles.

Conclusion
One could argue that even with our client's diversified portfolio, there remains too much exposure to U.S. names. But, as we discussed in our factor analysis, we adopt a diversified, lightly factor-tilted approach to minimise tracking error (and regret) from the overall market. We believe this gives our clients the best chance of sticking to their plan while optimising the sustainability of their retirement portfolio.

Want to find out more?
Please contact us if you would like help building a robust retirement portfolio based on proven strategies.
About us
The team at Pyrford Financial Planning are highly qualified Independent Financial Advisers based in Weybridge, Surrey. We specialise in retirement planning and provide financial advice on pensions, investments, and inheritance tax.
Our office telephone number is 01932 645150.
Our office address is No 5, The Heights, Weybridge KT13 0NY.
Please note: This blog is for general information only and does not constitute advice. The information is aimed at retail clients only.


Komentarze